

 Português pt
 Español es
 العربية ar
 বাংলা bn
 Deutsch de
 Filipino fil
 Français fr
 हिन्दी hi
 Bahasa Indonesia id
 Italiano it
 Русский ru
 Svenska sv
 ไทย th
 Türkçe tr
 Tiếng Việt vi
 简体中文 zh
Updated:
NewsWhy the Crypto Market Still Doesn't Have an S&P 500 to Call Its Own
 Kwame MensahEditorial character · Markets Desk

Quick answer
The crypto market doesn't have a single index like the S&P 500 because the candidates, like the CoinDesk 20, the S&P indices, and the Nasdaq-CME one, use different rules and arrive at different results. Lacking a single yardstick, traders combine Bitcoin's price, the market's total capitalization, and Bitcoin dominance.
On Wall Street, the S&P 500 is the market's yardstick. In the world of cryptocurrencies, there's no single index playing that role, and traders end up watching several indicators at once, which don't always agree.
One example shows the difference. The S&P 500 is near its highs, but about 257 of the 500 companies are below their 200-day average, a sign of a rally concentrated in a handful of names. In crypto, it's the opposite: 88 of the 100 largest tokens, including Bitcoin and Ethereum, are above that average.
The candidates for a benchmark
There's no shortage of candidates for a benchmark. The CoinDesk 20 gathers 20 liquid assets and caps the weight of the largest ones. S&P has a broad index, with almost 200 assets, and another with the 30 largest coins. Nasdaq and CME built an index aimed at institutional investors. Since each one measures things its own way, the results can diverge on the very same day.
The difference lies in the rules. An index that caps the weight of the largest assets gives more room to smaller coins; one that weights purely by market cap ends up practically mirroring Bitcoin and Ethereum. A broad index, with hundreds of assets, includes low-liquidity tokens that are barely traded; a narrow index can leave out exactly the project that grew the most during the year.

Why a single number isn't enough
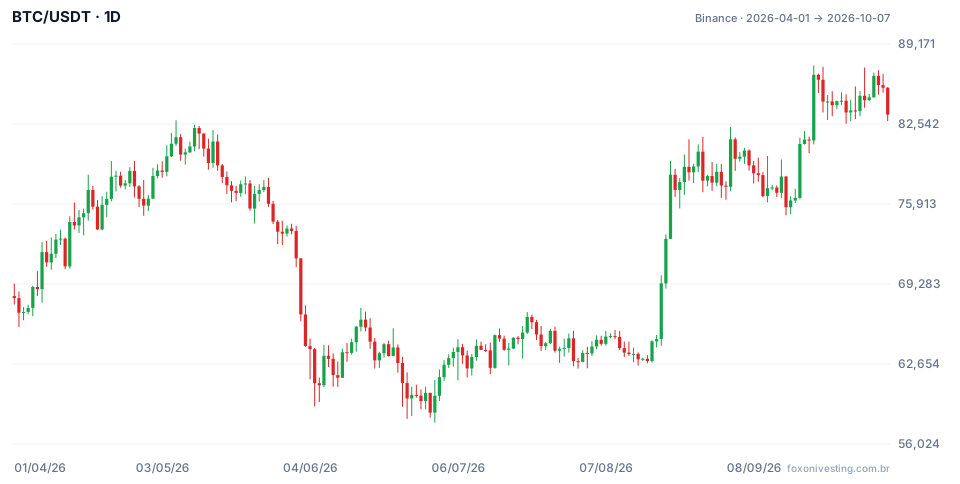
The chart shows bitcoin (BTC/USDT on Binance) from April 1, 2026 to October 7, 2026. Over the period, it went from $68,113.92 to $83,321.81, up 22.33%, with a low of $57,800.19 on July 1 and a high of $87,395.67 on September 21. On October 7 it was 16.1% above its own 200-day average, of $71,765.23, in line with the strength picture described above.
Other coins, over the same stretch, tell very different stories. Ether rose 20.27%, close to bitcoin. Dogecoin fell 3.42%. The NEAR token rose 347.94%. In an illustrative calculation with just these four assets, an equal-weighted index would have risen 96.78% over the period, while a market-cap-weighted index, dominated by bitcoin and ether, would have come in near 20%. The same basket, under two rules, would give two opposite readings on how the half-year went.
That's why none of the candidates has taken over. Each methodology answers a different question: how the market did as a whole, how the assets big investors can actually buy did, or how the average project did.
How traders find their bearings
In practice, traders combine three gauges: Bitcoin's own price, the market's total capitalization (with and without BTC and ETH), and Bitcoin dominance, which measures its share of the total value. When dominance rises, money is concentrating in Bitcoin; when it falls, it's spreading out into smaller coins.
Since the list of the largest projects changes fast and two assets concentrate much of the value, a single number may never be able to capture the crypto market. For anyone trading, the takeaway is to check more than one gauge before deciding whether the market is strong or weak, and to remember that the numbers above describe what happened, not what will happen.
Source: Traders Union.
Practice before you risk. Open your Fox On account and test your ideas on the demo account with US$10,000 in virtual funds.
Create free accountUpdated:
Editorial character of the Fox On newsroom. Articles are written by the team with the help of artificial intelligence; prices and charts come from real market data. Follows the news that moves prices — rates, stock markets, companies and commodities — explained without jargon.
Was this article helpful?
Be the first to rate it.
Comments
- No comments yet. Be the first to comment.
Ready to put it into practice?
Open your account and practice on the demo account with US$10,000 in virtual funds, without risking money.
- Secure platformProtected login and identity verification
- Multilingual supportHelp available every day
- Free demo accountUS$10,000 virtual to practice
Trading involves the risk of losing the capital invested.
