

 Português pt
 Español es
 العربية ar
 বাংলা bn
 Deutsch de
 Filipino fil
 Français fr
 हिन्दी hi
 Bahasa Indonesia id
 Italiano it
 Русский ru
 Svenska sv
 ไทย th
 Türkçe tr
 Tiếng Việt vi
 简体中文 zh
Updated:
NewsAlphabet (GOOGL) Loses Steam as Market Weighs AI Spending
 Kwame MensahEditorial character · Markets Desk
Quick answer
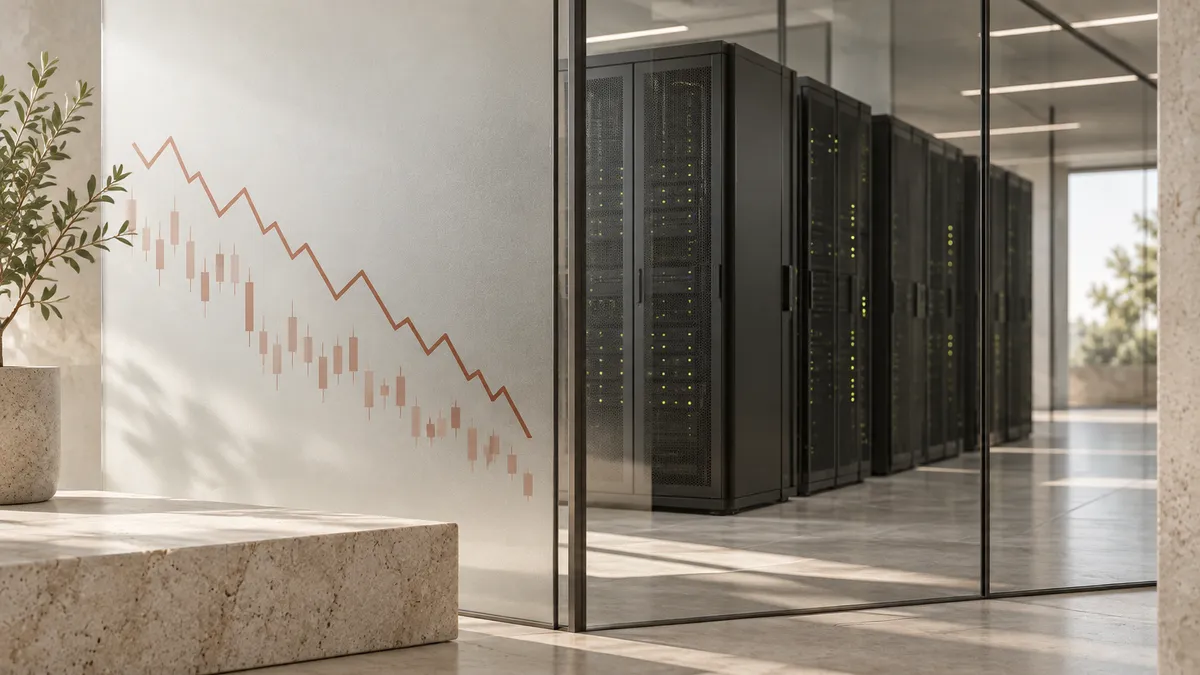
Alphabet (GOOGL) stock fell 3.8% on September 23, 2026 and returned to the US$ 340 region, even as Google Cloud grew 82% in the second quarter. The market has started demanding returns on the billions spent on artificial intelligence infrastructure.
Alphabet (GOOGL) shares, parent of Google, returned to the US$ 340 region on September 24, 2026, after failing to hold above the US$ 355 to US$ 360 range. On the one-hour chart, the stock lost its short-term moving averages and slipped back to the lower part of the range it had been trading in.
Yahoo Finance's daily figures show the move: on September 22 the stock reached US$ 364.17 intraday, but closed at US$ 351.16. The next day, September 23, it fell 3.8% and closed at US$ 337.83. On September 24 it ranged between US$ 336.02 and US$ 343.09 and ended the day at US$ 342.36.
Strong results, but the AI bill weighs
The pullback contrasts with the company's numbers. In the second quarter, revenue rose 24% year over year to US$ 119.8 billion. The standout was Google Cloud, which grew 82% to US$ 24.8 billion, driven by demand for infrastructure and artificial intelligence solutions. Operating income climbed 30% and the margin reached 34%.
What's weighing on the stock now is the cost of that race. Alphabet raised about US$ 49.6 billion in June to expand its computing capacity, and the market has started demanding returns on data centers, its own chips and Gemini, whose fourth generation could launch later this year. Competition is also a factor: interest in Meta Muse has made investors more nervous about the fight in the sector.
On the legal front, the news was less harsh than feared: the court did not force Google to sell AdX and DFP, its ad platforms, but it did require opening up part of the ad stack and six years of independent oversight.

GOOGL's 2026 chart
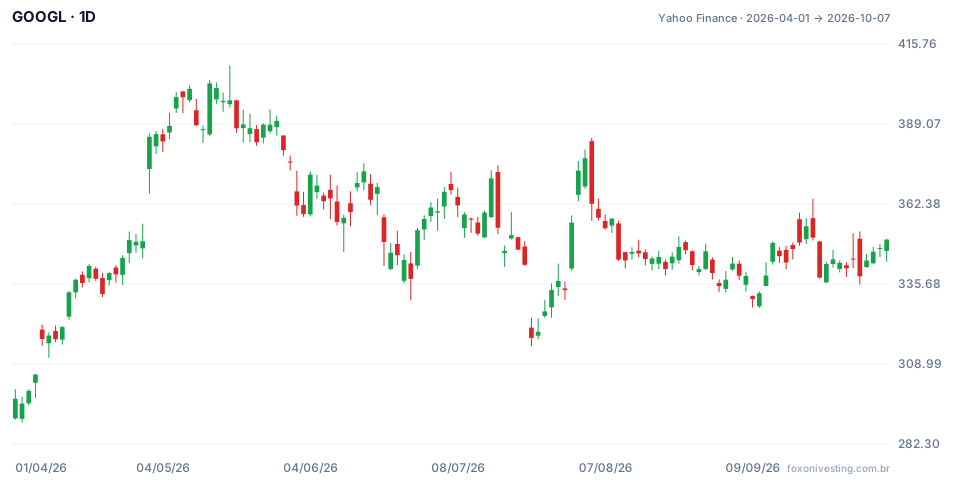
The daily chart shows that September's drop is part of a turbulent year. The stock closed 2025 at US$ 313.00 and, between April and May, lived through its strongest stretch: on April 30 it jumped 10.0% in a single day, from US$ 349.94 to US$ 384.80, and on May 18 it marked the period's intraday high, US$ 408.61.
From there the stock began correcting in waves. The period's biggest single-day drop came on July 23, down 7.1%, with the close going from US$ 342.09 to US$ 317.69. There was a recovery in early August, up to US$ 377.65 on August 4, but since mid-August the stock has mostly traded between US$ 330 and US$ 355.
Technical levels cited
In the technical reading published that day, the nearest support was at US$ 336 and, below it, at US$ 328. On the upside, a move above US$ 343 would open room up to the US$ 348 to US$ 350 region.
What happened over the following two weeks shows how those levels play out in practice. On October 1 the stock reached US$ 335.51 intraday, slightly below the US$ 336 support, but closed at US$ 338.24, without testing US$ 328. In the days that followed it rose again and, on October 7, closed at US$ 350.50, already inside the US$ 348 to US$ 350 range flagged as a target. At that close, GOOGL was up 12.0% for 2026, but still 14.2% below May's high.
Support and resistance are zones, not exact lines: price can poke through them for a few hours and come back, as it did on October 1. They're useful for defining where a trade idea stops making sense, not for predicting the next move. The behavior described above shows what happened after the news, not what will happen.

What to watch
- Capital spending: how much Alphabet will invest in data centers and chips over the coming quarters, and whether that shows up in cloud revenue.
- Google Cloud: whether the near-80%-a-year growth pace holds up.
- Gemini and competition: how the next generation of the model is received against rivals.
- Regulation: how independent oversight in the ad business plays out.
This text is informational and is not a recommendation to buy or sell. To follow the stock without risking money, open GOOGL's chart on a demo account, mark the levels mentioned here, and log how the price reacts to each one.
Source: Traders Union.
Practice before you risk. Open your Fox On account and test your ideas on the demo account with US$10,000 in virtual funds.
Create free accountUpdated:
Editorial character of the Fox On newsroom. Articles are written by the team with the help of artificial intelligence; prices and charts come from real market data. Follows the news that moves prices — rates, stock markets, companies and commodities — explained without jargon.
Was this article helpful?
Be the first to rate it.
Comments
- No comments yet. Be the first to comment.
Ready to put it into practice?
Open your account and practice on the demo account with US$10,000 in virtual funds, without risking money.
- Secure platformProtected login and identity verification
- Multilingual supportHelp available every day
- Free demo accountUS$10,000 virtual to practice
Trading involves the risk of losing the capital invested.
