

 Português pt
 Español es
 العربية ar
 বাংলা bn
 Deutsch de
 Filipino fil
 Français fr
 हिन्दी hi
 Bahasa Indonesia id
 Italiano it
 Русский ru
 Svenska sv
 ไทย th
 Türkçe tr
 Tiếng Việt vi
 简体中文 zh
Updated:
NewsBitcoin Slips Below US$ 83,750 as US Yields Hit Multi-Year High
 Kwame MensahEditorial character · Markets Desk

Quick answer
On September 24, 2026, bitcoin lost the US$ 83,750 support and pulled back to the US$ 83,400-83,500 region, pressured by the US 10-year Treasury yield above 5%. The drop came even as bitcoin ETFs added up to about US$ 2.65 billion in net inflows over five sessions.
Bitcoin pulled back to the US$ 83,400-83,500 region on September 24, after losing the US$ 83,750 support. On the four-hour chart, the broader trend was still bullish, since the price remained above the medium-term averages, but momentum had lost strength.
The pressure came after a fast climb. On Binance's BTC/USDT pair, the daily close went from US$ 76,417.01 on September 17 to US$ 86,620.00 on September 21, up 13.4% in four days, with a high of US$ 87,395.67 on September 21. Over the next two days, the daily low fell to US$ 83,500.01 (September 23) and US$ 82,874.93 (September 24).
US yields at the center of the pressure
The main culprit was the US bond market. The 10-year yield moved past 5%, near its highest level since 2007, and the 30-year hit about 5.44%. Not even the US Treasury's buyback program, expanded in August and September, managed to hold yields down for long.
High yields on bonds considered safe raise the opportunity cost of holding assets that pay no yield, like bitcoin, and tend to come paired with a strong dollar. That was the backdrop for the pullback.

ETFs keep buying
On the other hand, institutional demand stayed firm. After outflows on September 15 and 16, bitcoin ETFs began receiving inflows again and added up to about US$ 2.65 billion in net inflows over five sessions, led by funds from BlackRock, Fidelity, and Morgan Stanley. Even so, the price gave way, a sign that high rates, a strong dollar, and profit-taking weighed more heavily at that moment.
Derivatives and levels being watched
In derivatives, the drop in open interest pointed to more position closing than new bets against bitcoin. In the reading of the analysts cited by the source, a correction down to the US$ 83,000-82,000 range would still be considered normal within the uptrend; losing that range, however, could send the price back to the range it was in before the latest breakout.

What the price did next
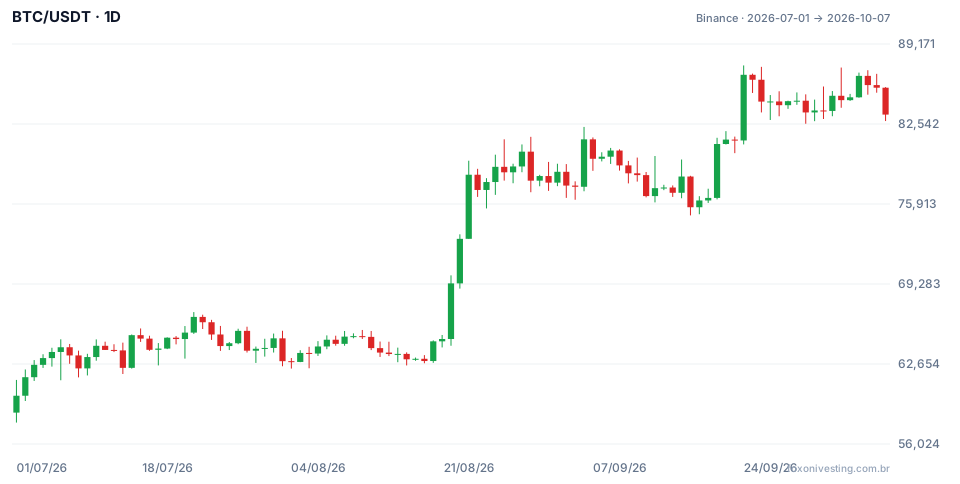
The chart shows BTC/USDT from July to October 2026. Over the period, the price went from US$ 60,024.00 on July 1 to US$ 83,321.81 on October 7, up 38.81%, with a low of US$ 57,800.19 on July 1 and a high of US$ 87,395.67 on September 21.
After the news, the range cited by the analysts was tested, but not lost, through October 7:
- On September 24, the daily close was US$ 84,410.24, above the support that had been lost intraday.
- The lowest low after that came on September 28, at US$ 82,563.00, within the US$ 83,000-82,000 range.
- On October 4, the price closed again at US$ 86,530.00, near September's high.
- On October 7, it dropped again, with a low of US$ 82,787.25 and a close of US$ 83,321.81, the lowest close since September 20.
In short, over the following two weeks bitcoin moved sideways between roughly US$ 82,500 and US$ 87,300 (a high of US$ 87,220.00 on October 2), without closing below US$ 83,000. These numbers describe what happened through October 7, not what will happen: the support range only means something while the market respects it.
What to watch
For anyone following the asset, the points of attention remain the same as in the original news: the direction of long-term US yields, the daily flow of bitcoin ETFs, and how the price behaves in the US$ 82,000-83,000 range. Trading near heavily watched support levels tends to bring fast moves in both directions, and position size should account for that. Anyone who wants to test readings like this without risking money can follow the price on a demo account and note how it reacts each time the range is tested.
Source: Traders Union.
Practice before you risk. Open your Fox On account and test your ideas on the demo account with US$10,000 in virtual funds.
Create free accountUpdated:
Editorial character of the Fox On newsroom. Articles are written by the team with the help of artificial intelligence; prices and charts come from real market data. Follows the news that moves prices — rates, stock markets, companies and commodities — explained without jargon.
Was this article helpful?
Be the first to rate it.
Comments
- No comments yet. Be the first to comment.
Ready to put it into practice?
Open your account and practice on the demo account with US$10,000 in virtual funds, without risking money.
- Secure platformProtected login and identity verification
- Multilingual supportHelp available every day
- Free demo accountUS$10,000 virtual to practice
Trading involves the risk of losing the capital invested.
