

 Português pt
 Español es
 العربية ar
 বাংলা bn
 Deutsch de
 Filipino fil
 Français fr
 हिन्दी hi
 Bahasa Indonesia id
 Italiano it
 Русский ru
 Svenska sv
 ไทย th
 Türkçe tr
 Tiếng Việt vi
 简体中文 zh
Updated:
NewsUniswap (UNI) Falls 11.7% Despite CME's Regulated Futures News
 Kwame MensahEditorial character · Markets Desk

Quick answer
Uniswap's token (UNI) fell 11.7%, to $9.20, even after the CME Group announced regulated futures contracts for the asset. The drop came right after a more than 50% rally in a single week, and over the following two weeks the price never recovered the high: on October 7, 2026 it closed at $7.91 on Binance.
Uniswap's token (UNI) fell 11.7% and was trading at $9.20, according to the report that originated this news. That put it below the 20-day ($9.27) and 50-day ($9.51) moving averages used in the report, though it remained well above the 200-day average, at $3.88.
The drop came despite news seen as positive: the CME Group announced regulated UNI futures contracts, in a standard version of 10,000 tokens, and a Micro version of 1,000 tokens. The move widens access for institutional investors, but the market is still assessing when and how these products will gain volume.
What the report said
The technical signals cited pointed to selling pressure. The MACD signaled a strong sell, the RSI was at 41.80, and the session had a gap down at the open and closed near the low. The nearest resistance was at $9.79.
For the next two or three sessions, the report's expectation was for the price to swing between $8.46 and $10.83, with an estimated 74% chance of further declines. The $8.46 level became the support to watch.
One caveat is worth noting: the report's moving averages and RSI don't match the ones on Binance's daily chart, probably because the source uses a different timeframe or a different price feed. On Binance's daily chart, for example, the 20-day average was $7.35 at the September 23 close, and the 14-period RSI was 68.8. Indicators depend on the timeframe and the exchange the prices come from; comparing numbers from different sources without knowing that leads to wrong conclusions.

The context: a more than 50% rally in a week
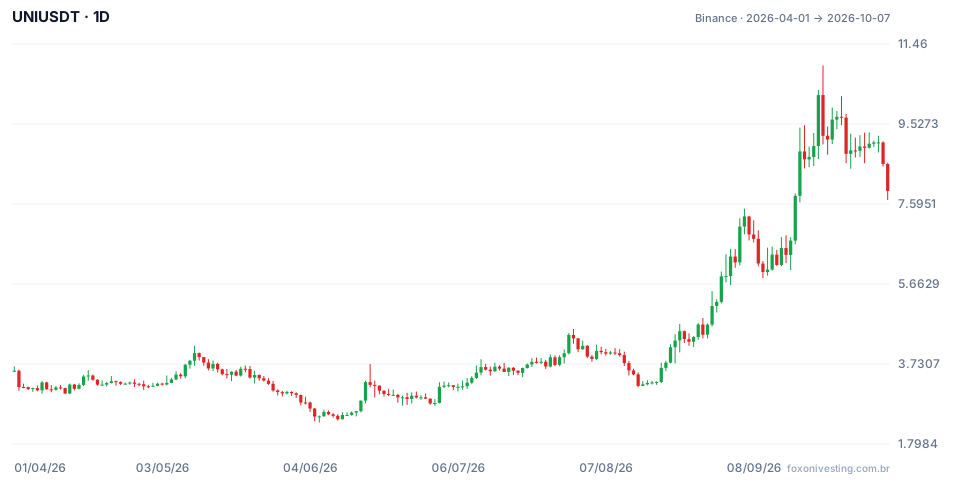
The chart shows UNI/USDT on Binance from April to October 2026. The token spent most of the period between $2.50 and $4.50 and marked the window's low on June 6, 2026, at $2.32. Starting at the end of August the price accelerated: it closed at $6.71 on September 16 and at $10.23 on September 22, a 52.4% rally in six sessions. On September 18 and September 22, traded volume topped 22 million tokens a day, more than three times the daily average for August and the first half of September, which stayed near 6.8 million.
On September 23 the price reached $10.94, the high for the entire window, and reversed within the same session: it closed at $9.24, 15.5% below the day's high and 9.6% below the previous close. That's the move the report describes. From June's low to September's high, the rally had been 371.6%.
What happened next
Data from after the report lets us check what followed, without that saying anything about the future:
- September 24 to 26: the price stayed within the range the report predicted. The high for those three days was $9.93 and the low was $8.79, both between $8.46 and $10.83.
- September 28: another 9.0% drop, closing at $8.81. The next day the low touched $8.45, practically right on the $8.46 support, and the price closed back above it.
- First week of October: UNI traded sideways between $8.88 and $9.08 at the close through October 5. On October 6 it fell 5.7%, and on October 7 another 7.6%, closing at $7.91, 6.5% below the support mentioned and 27.7% below the September 23 high.

Why a positive announcement can coincide with a drop
When the price rises a lot ahead of a news event, part of the buyers are already in profit and use the moment to sell. On top of that, regulated futures contracts open room for institutional short positions, not just long ones. None of this guarantees the price's direction: the CME announcement is a market-structure fact, and its effect on UNI's volume and liquidity will only show up over time.
Crypto assets like UNI have much higher volatility than stocks and indexes: swings of 9% to 16% in a single day show up several times in the chart above. Anyone who wants to study this kind of move can follow the asset in a demo account and record how the price reacts to news, without risking money.
Source: Traders Union.
Practice before you risk. Open your Fox On account and test your ideas on the demo account with US$10,000 in virtual funds.
Create free accountUpdated:
Editorial character of the Fox On newsroom. Articles are written by the team with the help of artificial intelligence; prices and charts come from real market data. Follows the news that moves prices — rates, stock markets, companies and commodities — explained without jargon.
Was this article helpful?
Be the first to rate it.
Comments
- No comments yet. Be the first to comment.
Ready to put it into practice?
Open your account and practice on the demo account with US$10,000 in virtual funds, without risking money.
- Secure platformProtected login and identity verification
- Multilingual supportHelp available every day
- Free demo accountUS$10,000 virtual to practice
Trading involves the risk of losing the capital invested.
